Rep-seq or full-length sequencing of adaptive immune repertoires
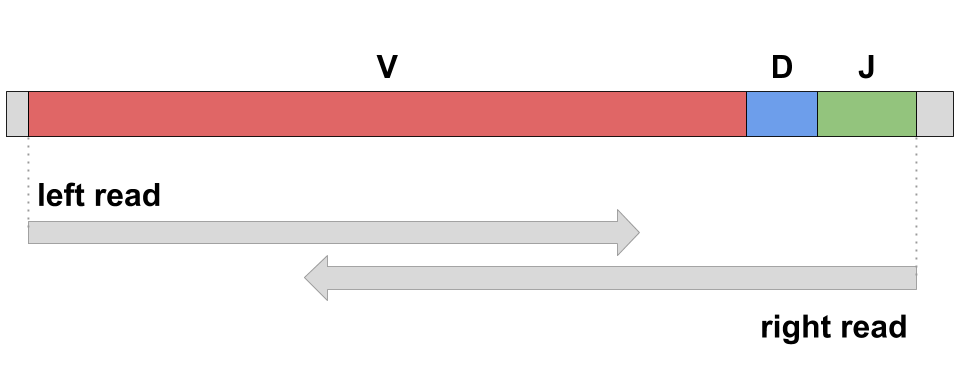
Modern sequencing technologies (e.g., Illumina MiSeq) allow biologists to perform full-length scanning of adaptive immune repertoire. For example, a pair of overlapping paired-end Illumina MiSeq reads (250x2 or 300x2) is able to cover a variable region of antibody or TCR:
Our tools for analysis of adaptive immune repertoires
Sequencing data of adaptive immune repertoires or Rep-seq is an input of various immunological studies. We propose a set of tools for solving related immunoinformatics problems:
- Repertoire construction and its quality assessment
- Immunoproteogenomics
- Diversity and clonal analysis

|
| Y-tools in a nutshell |
- IgReC performs construction of antibody repertoire from immunosequencing reads: it corrects sequencing and amplification errors and joins together reads corresponding to identical antibodies. Constructed repertoire present a highly accurate input for various immunological applications, e.g., construction of clonal trees, V(D)J labeling / CDR3 classification, mass spectra identification etc.
- If your sequencing data contains unique molecular identifiers (or UMIs), we recommend to use Barcoded IgReC, a modification of IgReC tool for processing barcoded Rep-seq libraries.
- Diversity Analyzer: a tool for diversity analysis of Rep-seq data. Diversity Analyzer computes VJ, CDR, and SHM labelings of input receptor sequences. It also visualizes various statistics that help to analyze characteristics of an input dataset.
- IgQUAST: a quality assessment tool for full-length adaptive immune repertoires. IgQUAST analyzes a repertoire based on an original Rep-seq library and a reference repertoire (if available). IgQUAST detects over- and undercorrection of clusters, computes sensitivity and specificity of a repertoire, and analyzes repertoire abundances.
- AntEvolo: an algorithm for construction of clonal trees for an antibody repertoire.
- Mass Spectra Analyzer is a tool for immunoproteogenomics analysis. Repertoire constructed by IgReC can be converted into a database and used for mass spectra identifications (using some standard tool, e.g., MS-GF+). Mass Spectra Analyzer performs analysis of the computed matches and computes various statistics showing similarity of the constructed repertoire and mass spectra.
Construction of full-length adaptive immune repertoires
Repertoire construction problem
Repertoire construction is a preliminary step of any immunological analysis based on Rep-seq reads. Accurate construction of adaptive immune repertoire (antibody / TCR) avoids erroneous analysis of natural variations and antibody abundances.
Repertoire construction problem can be formulated as a huge instance of error-correction or read clustering problem:

|
Input / output
A repertoire construction tool takes full-length Rep-seq reads as an input and constructs a repertoire as a set of clusters. Each cluster represent a group of reads corresponding to identical antibody (or TCRs) chains. Clusters in a repertoire are characterized by sequence and abundance. IgReC reports repertoires in CLUSTERS.FASTA and RCM formats.
IgReC
IgReC takes as an input reads (paired-end or single) covering variable region of antibodies and corrects sequencing and amplification errors. Algorithm performs the following steps:
- VJ Finder: VJ labeling, cleaning and cropping input reads.
- Constructing & clustering Hamming graph: representation of cleaned reads as a Hamming graph and finding of groups of highly similar antibodies.
- Receptor sequence construction: reconstruction of antibody sequences from the constructed groups, cleaning amplification errors.
VJ Finder
The main goals of VJ Finder tool are:
- Finding and discarding contaminated reads.
- Cropping remaining immunosequencing reads by the start position of the closest V gene segment and the end position of the closest J gene segment. VJ Finder also discards reads covering V gene segment only since they can not be unambiguously assigned to a cluster in a repertoire.
VJ Finder outputs information about the closest V and J gene segments in tab-separated view:
| Read id | V start | V end | V score (% identity) | V id | J start | J end | J score (% identity) | J id |
| read1 | 1 | 296 | 100.0 | IGHV3-20*01 | 321 | 366 | 89.0 | IGHJ5*02 |
| read2 | 1 | 294 | 98.64 | IGHV3-9*01 | 309 | 354 | 100.0 | IGHJ2*01 |
| ... | ... | ... | ... | ... | ... | ... | ... | ... |
Constructing & clustering Hamming graph
IgReC constructs Hamming graph to identify similar Rep-seq reads. Vertices of Hamming graph represent unique reads. An edge connects read1 and read2 if Hamming distance between these them is relatively small.
After construction of graph, IgReC launches DSF for finding dense subgraphs. Dense subgraphs correspond to groups of highly similar antibodies:
 |
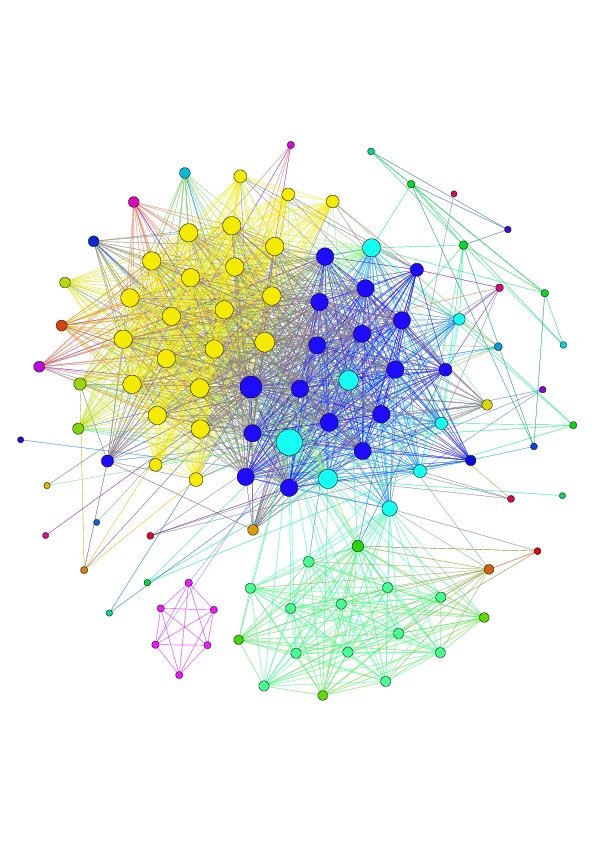 |
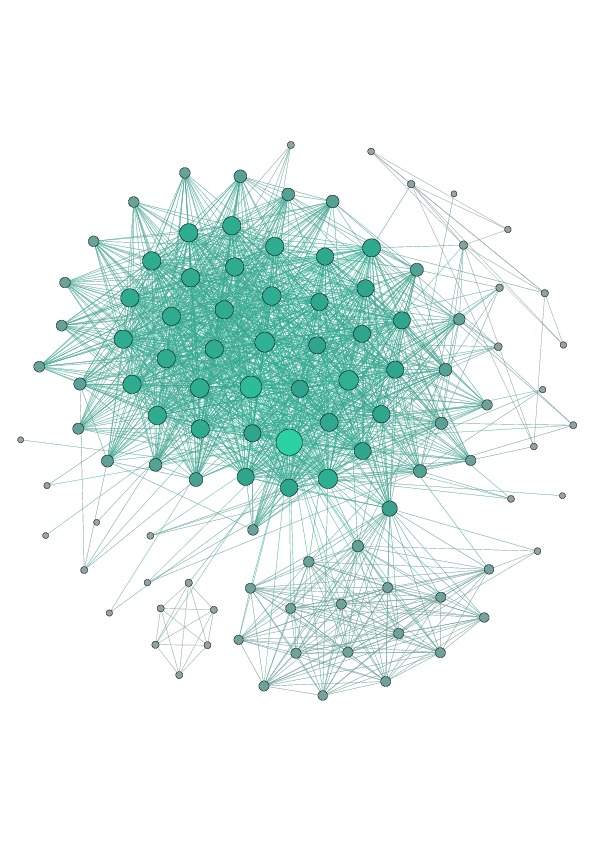
| Example of connected component of Hamming graph constructed from immunosequencing reads (heavy chain human repertoire). | Clustering of Hamming graph performed by DSF. Each color corresponds to antibody cluster in repertoire. |
Mass Spectra Analyzer
This step performs immunoproteogenomics analysis to validate constructed repertoire using mass spectra. It takes alignment of mass spectra against constructed repertoire in mzIdentML 1.1 format (e.g., generated by MS-GF+) as an input and outputs a set of metrics and plots that show similarity between constructed repertoire and mass spectra:
 |
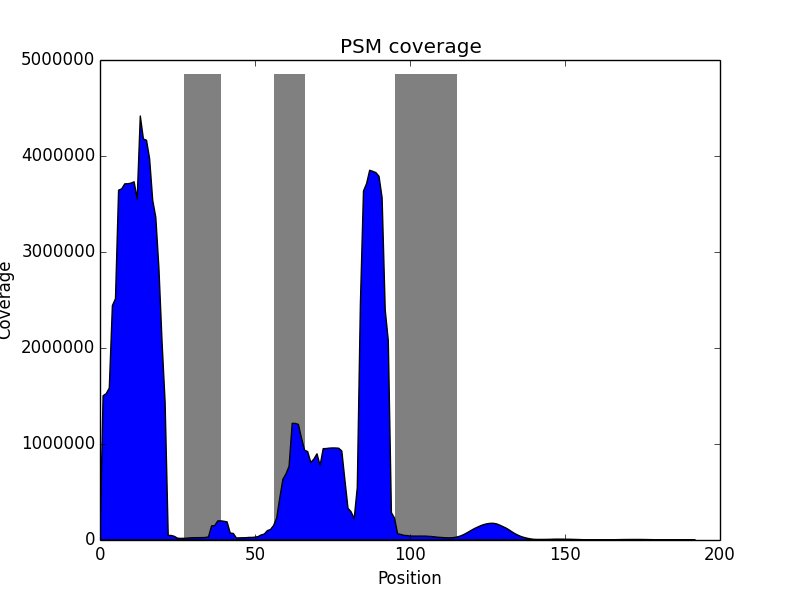 |
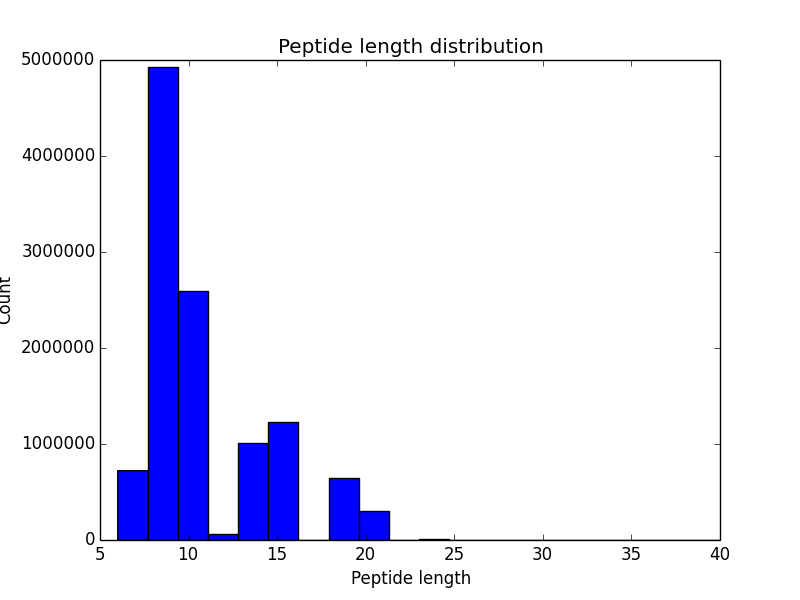
| Histogram of peptide length distribution. | Histogram of variable region coverage by PSMs. Grey bars correspond to expected positions of CDRs. |
Manual and citations
- IgRepertoireConstructor manual can be found here.
Citations
If you use our tools in your research, please cite our papers:
- IgReC / BarcodedIgReC / IgQUAST / DiversityAnalyzer: Alexander Shlemov, Sergey Bankevich, Andrey Bzikadze, Dmitry Chudakov, Yana Safonova, and Pavel A. Pevzner. Reconstructing antibody repertoires from error-prone immunosequencing datasets. Submitted.
- Immunoproteogenomics search / DSF: Yana Safonova, Stefano Bonissone, Eugene Kurpilyansky, Ekaterina Starostina, Alla Lapidus, Jeremy Stinson, Laura DePalatis, Wendy Sandoval, Jennie Lill, and Pavel A. Pevzner. IgRepertoireConstructor: a novel algorithm for antibody repertoire construction and immunoproteogenomics analysis. Bioinformatics. 2015 Jun 15; 31(12): i53-i61. doi: 10.1093/bioinformatics/btv238.